APPENDICES
A. The Nature of the Keypoints for a Pulse
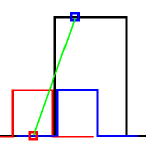
We consider a pulse function (zero for all x, except for an interval of length W where it equals H) with a convolving kernel that is a "boxcar" function as stated in Section 2. If the support of the kernel is entirely outside the pulse the result of the convolution will be 0, while if it is entirely within the pulse the result will be 1. This is shown in Figure FA1 where the two positions of the kernel are shown in different colors. The values of the convolution between the two extreme positions fall all on a line with equation y1 = H(1/2 + x/S) (shown in green). There will be a symmetric line on the other side of the pulse with equation y2 = H(1/2 + (w-x)/S) (not shown). The origin of x is at the place of the rise of the pulse.
 |
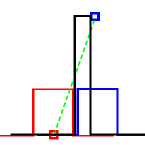 |
| Figure FA1: Results of convolution when the support of the kernel is less than the width of the pulse. | Figure FA2: Results of convolution when the support of the kernel is greater than the width of the pulse. |
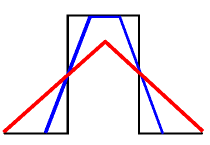
When the support of the kernel exceeds the width of the pulse only part of each line is valid (Figure FA2, line is shown in dashed style.) In the first case the shape of the convolution is a trapezoid while in the second is a triangle whose peak is found as the intersection of the "left" and "right" lines. x is found equal to W/2 (by setting y1 equal to y2) and the common y is H/2(1 + W/S). The two forms are shown in Figure FA3.
 |
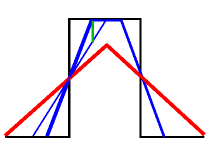 |
| Figure FA3: Results of the convolution where the kernel support is less (blue) and greater (red) than the pulse width. | Figure FA4: Illustration of the position and size (In green) in the maximum difference w.r.t. x for two "blue" curves. |
We take now the difference in the values of y for two values of s. We denote the second value by qS (q> 1). If both S and Sq are less than W, then as a function of x, the maximum difference occurs when of them equals 1 as shown in Figure FA4. Then
Thus the difference is a decreasing function of q and independent of s. When both values of s are greater than W the largest difference with respect to x occurs at the middle (between the vertices of two "red" triangles and that yields D(q) = (W/S)[1/2(1-1/q)], or
Equ. (EA1) shows that when the support of the kernel s
is smaller than W, the difference depends only
on the ratio between the values of support, so we should not expect to
find an extremum in that range. Equ. (EA2) shows that when both supports
exceed W, the difference is a decreasing function
of s and the maximum occurs when S
equals W. Thus the candidate for a keypoint
does occur when the support of the kernel matches the width of the pulse.
Note that d(q) and D(q)
do not depend on the amplitude H.
A Practical Issue: Equ. (EA1) states that the difference between two results of two convolutions is fixed when both values of S are smaller than W. However this is only a theoretical result. In practice this may not be the case because of numerical computational errors (typically truncation) so there may be slight fluctuations in d(q) that may lead to false extrema. (False in the sense that they are caused by numerical errors rather than the nature of the data.)
It is possible to repeat this analysis for other kernels of finite support (for example a triangular kernel) as well as in two dimension but the algebra gets messier, although it is still elementary. It is probably more instructive to look at plots of the convolutions of a pulse with a Gaussian kernel and the numerical results as shown in Figures FA5 and FA6. The first column denotes the value of σ, the second column the value of D(σ) and the third the location of the maximum for a pulse of width 40, centered at 125. (The tables, including the marking of the maxima, have been produced as part of the plot by a program.)
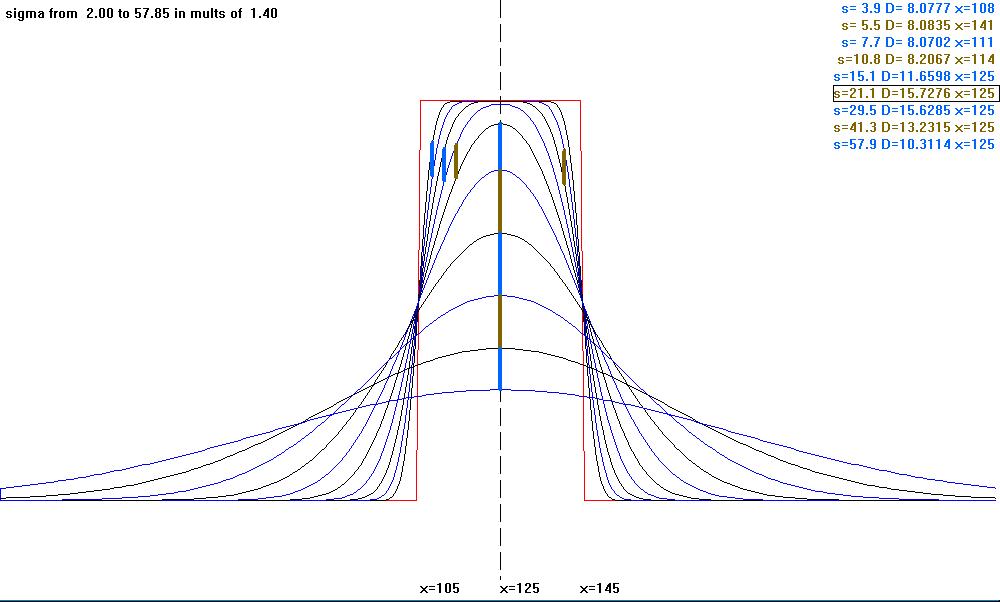 |
Figure FA5: (Click on the figure to see the plot of the Gaussians.) The maximum occurs for σ equal to 21.1. The results are qualitatively similar with those obtained for the constant kernel because a value of 2σ seems a good approximation for the support of a Gaussian kernel. (The symbol s in the figure stands for σ.) |
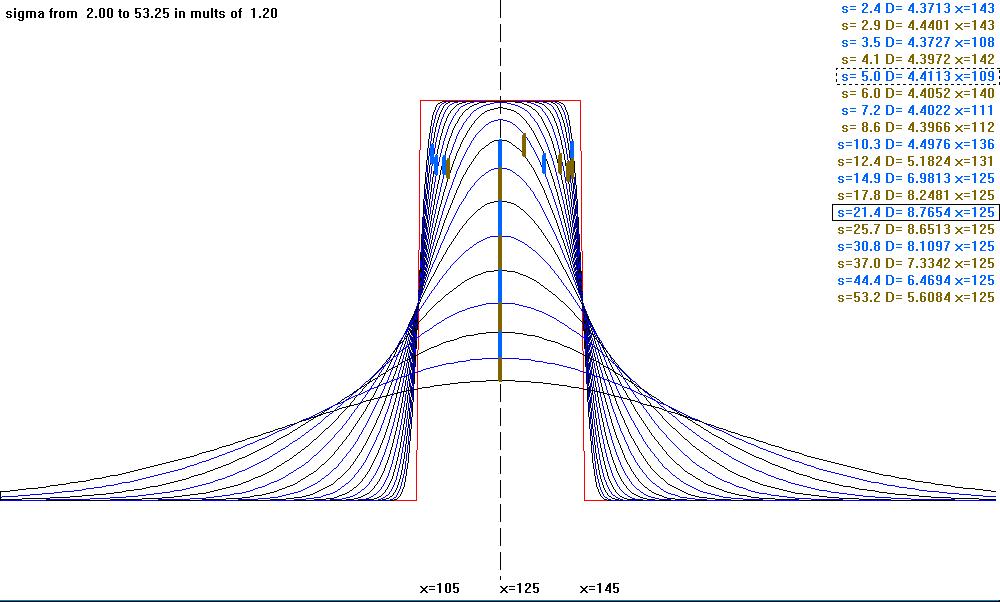 |
Figure FA6: (Click on the figure to see the plot of the Gaussians.) In addition to the strong maximum for σ equal to 21.4 (in agreement with the behavior of a constant kernel) there is also a weak maximum at σ equal to 5. Such a maximum is not predicted from the behavior of a constant kernel and it could be due to numerical factors. However, we cannot exclude the possibility of a different behavior of the Gaussian kernel compared to the "boxcar" kernel as discussed in Section 2. (The symbol s in the figure stands for σ.) |
B. The Nature of the Keypoints for a Step
The expressions of the difference between two convolutions for a step are given only by Equ. (EA1), so they are independent of σ. In the numerical simulation for a Gaussian kernel we observe only small fluctuations as shown in Figure FA7.
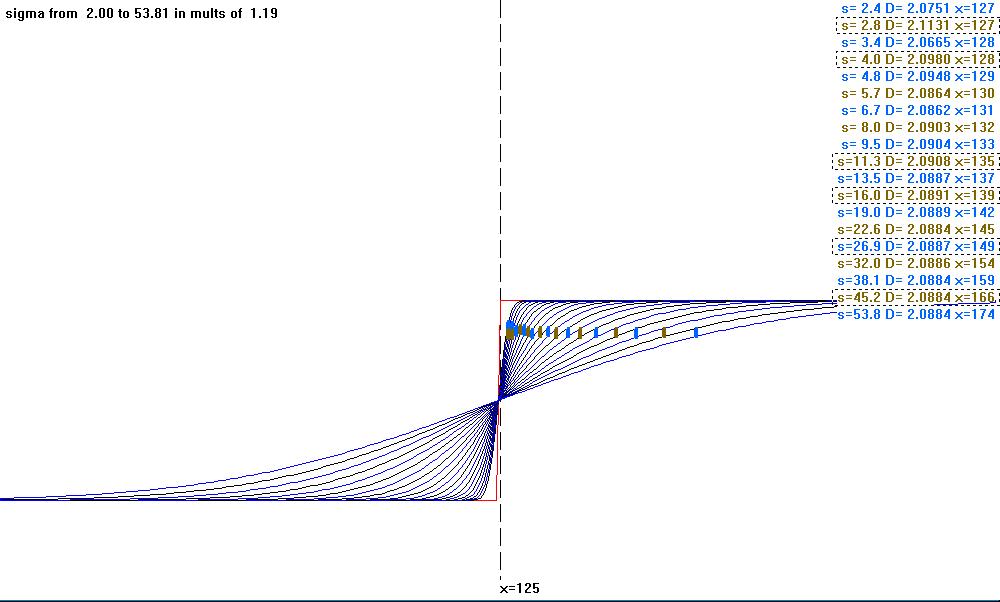 |
Figure FA7: (Click on the figure to see the plot of the Gaussians.) There are several weak maxima. In one case (for s=45.2) the difference is past the four decimal digits displayed. (The symbol s in the figure stands for σ.) |