1. The Three "Circles": See the introductory document
2. Gaussian Distributions: The plots of Gaussian distributions and the two vertical lines in following image (used to illustrate the significance of optimal classifiers) were produced by a short program, imported into PED, saved as a metafile, and then imported into Word where the text labels and the two arrows were added. The quality of the curves is much better in the original document.
3. Filled Circles:
Filled objects are filled
only with solid black, but another editor can be used to convert the filling to
other colors and textures as shown in the example below.
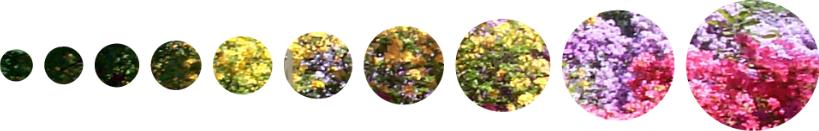
The circle positions and sizes are specified by a program
with about 15 lines of code,
they are imported into PED, saved as a metafile, and then
imported to PhotoDraw where they are filled with a picture. The result has been
saved as a JPEG file.